
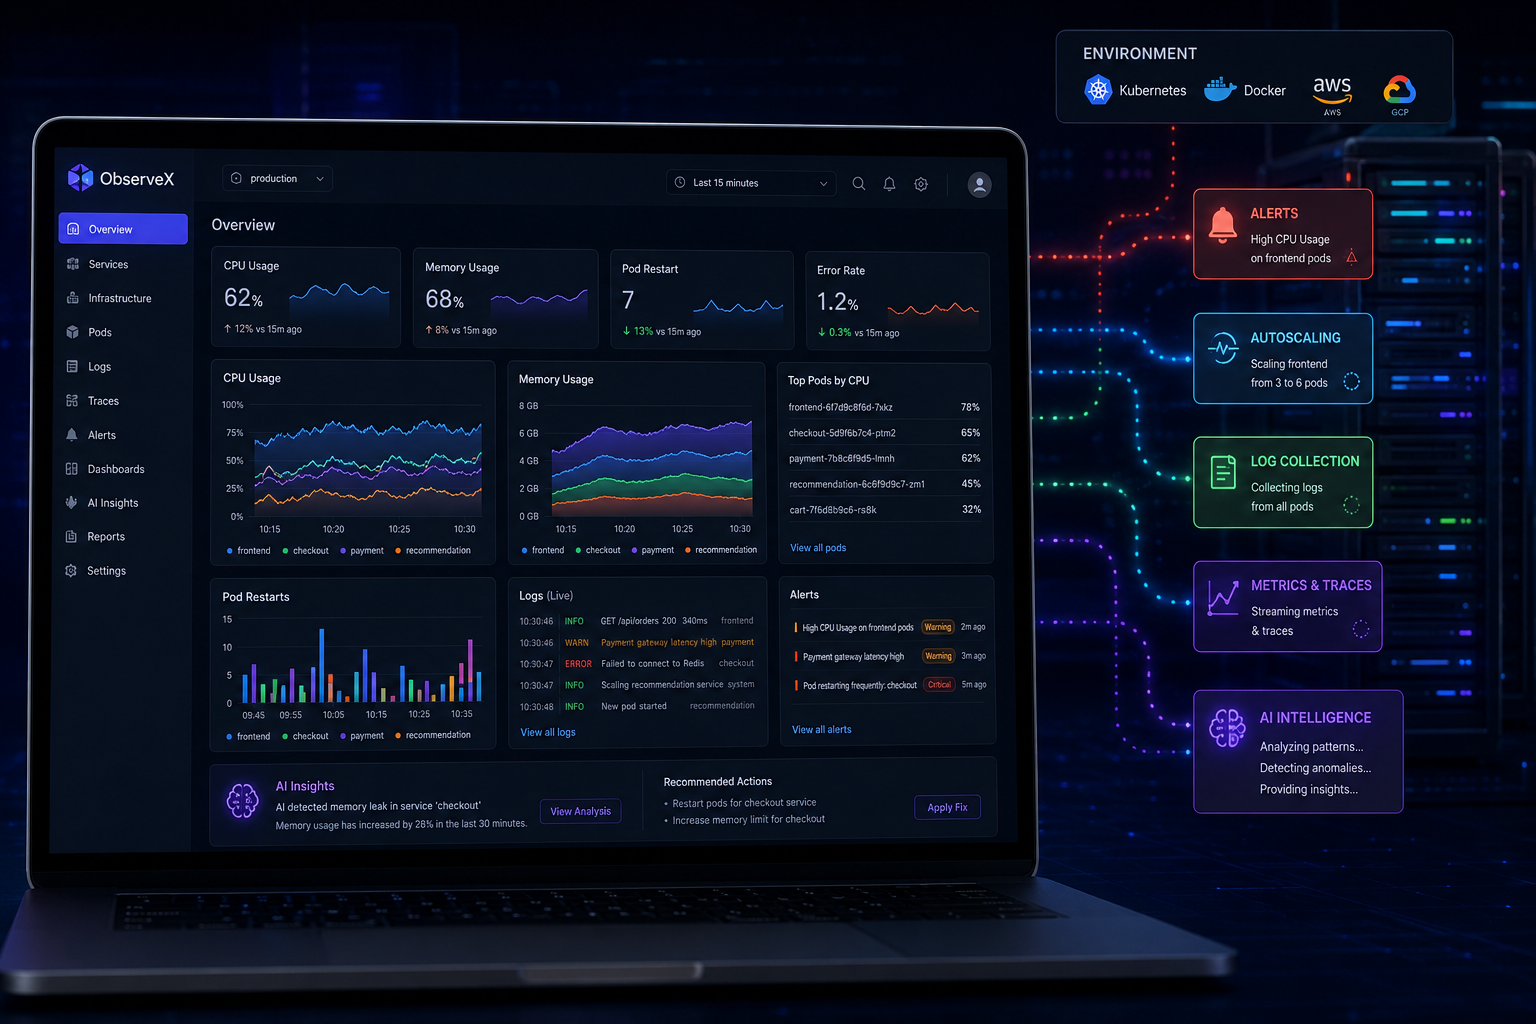
Complexity requires absolute transparency. At Plotkai Interactive, we build enterprise-grade observability and telemetry architectures that unify your logs, metrics, traces, and code quality data into a single, high-fidelity source of truth. We eliminate blind spots, dramatically reduce MTTR, and ensure absolute operational resilience.
Our Observability & Telemetry Pillars
Explore the specialized monitoring layers, unified dashboard configurations, and static quality gates we build to keep your platforms resilient.
APM & Distributed Tracing
Trace transaction paths from client portals to downstream databases. We integrate enterprise APM suites to pinpoint slow database queries and transaction bottlenecks.
- ✔ Full-stack performance tracing via **Datadog**, **New Relic**, or **Dynatrace**
- ✔ Continuous CPU and memory execution profiling in production
- ✔ Synthetic monitoring loops to verify critical user paths
Infrastructure & K8s Metrics
Capture fine-grained container and node-level operational health. We implement metric scraping pools and cluster exporters to feed live autoscaling triggers.
- ✔ Multi-cluster scraping architectures powered by **Prometheus**
- ✔ Real-time Kubernetes CPU/Memory metric servers and node exporters
- ✔ Dynamic custom metric exports supporting HPA/KEDA setups
Service Mesh & Network Observability
Audit communication patterns inside complex microservice topologies. We design zero-trust service networking graphs that reveal mutual TLS states and error rates.
- ✔ Dynamic traffic telemetry and routing control using **Istio**
- ✔ Visual network service-to-service maps utilizing **Kiali**
- ✔ Mutual TLS configuration auditing and network-level retry analytics
Unified Dashboards & Visualization
Establish custom, real-time visual control decks pulling from across your stack. We optimize database queries to drive responsive dashboard panels with zero latency.
- ✔ Dynamic, multi-tenant visual interfaces designed in **Grafana**
- ✔ Correlated panel views mapping infrastructure KPIs alongside business metrics
- ✔ Optimized multi-datasource query systems avoiding browser choke points
GitOps Deployment Monitoring
Bring declarative delivery states under live visual telemetry. We construct visual mapping grids that alert on drift between Git and live cluster deployments.
- ✔ Continuous deployment sync-state telemetry via **Argo CD** dashboards
- ✔ Immediate configuration drift alarms alerting on manual cluster alterations
- ✔ Detailed deployment history dashboards featuring inline file diffs
Code Quality & Security Dashboards
Establish strict code hygiene before deployments reach production. We configure automated static analyzers to evaluate security standards in development loops.
- ✔ Continuous integration quality gates powered by **SonarCloud**
- ✔ High-reliability static application security testing (SAST) via **Coverity**
- ✔ Centralized code quality dashboards tracking test coverage and security debt
Proactive Alerting & Hardening
Suppress noise and focus on real operational failures. We configure intelligent, dynamic alert rules that route alerts with exact context and debugging links.
- ✔ Dynamic anomaly alerts managed by Prometheus Alertmanager
- ✔ Multi-channel incident routing (Slack, PagerDuty, Opsgenie, Email)
- ✔ Integrated alert runbooks with live debugging dashboards linked
Log Aggregation & Indexing
Parse and index structured logs across hundreds of microservices. We establish highly optimized pipeline indices designed for fast searching.
- ✔ Petabyte-scale log aggregation streams using **Elasticsearch** and **Loki**
- ✔ Automated log parsing, JSON structure validation, and metadata labeling
- ✔ Fast pattern filtering to identify recurring system abnormalities
Proven Observability Impact
Telemetry metrics tracked across our deployed enterprise observability integrations.
Our Observability Modernization Roadmap
How we align your platform metrics into a unified engineering control center.
1. Telemetry Audit & Architecture Alignment
We map your application nodes, trace boundaries, current logging overheads, and security gate needs, selecting the optimal tooling mix (Datadog, Prometheus, Coverity).
2. Agent Instrumentation & Collector Deployment
We roll out Prometheus operators, Istio meshes, APM agents, and Coverity pipeline analyzers using automated GitOps delivery manifests.
3. Unified Dashboard Harmonization
We construct customized Grafana, Kiali, and Argo CD dashboards that stitch metrics, code coverages, and sync health under a single executive glass panel.
4. Proactive Alert Tuning & Noise Reduction
We configure smart anomaly threshold rules, integrate multi-channel pager routers, verify automated runbooks, and guarantee rapid response times.
Ready for Absolute System Clarity?
Struggling with high MTTR, alert fatigue, blind spots in your service mesh, or disjointed quality gate dashboards? Let our telemetry and platform engineers evaluate your stack with a Free Telemetry Architecture Audit.